

The nation in numbers – How Census data can supercharge your geography lessons
Steve Brace looks at how official Census data can provide some illuminating context for your students’ explorations of human geography…

- by Steve Brace
- Chief executive of the Geographical Association
One of the things that makes geography such a rewarding, and at times challenging subject is its need to respond to a changing world.
This calls for up-to-date information concerning people, places and processes – indeed, Ofsted’s research review series recently highlighted the need for geography lessons to accurately represent the diversity of people, communities and economies.
So when teaching lessons about the UK and the characteristics of our human landscapes, we have access to an invaluable tool in the data collected through the Census.
A telling snapshot
Starting in 1801, the Office for National Statistics Census has since taken place every 10 years, the only exception to date being the cancelled Census of 1941. These 10-yearly reviews help to support decision making across various areas of government, planning, finance and business in response to changing demand for public services – but they can also provide teachers with an informative map of the UK’s human geography.
The 2021 Census for England, Wales and Northern Ireland was undertaken in March, right in the midst of the COVID pandemic (Scotland’s having been delayed until 2022). Once the data has been made publicly available, it will provide a telling snapshot of life during an extraordinary period of time.
As Professor Danny Dorling has observed, it will “Capture young adults temporarily ensconced in parents’ homes, thousands of mainland Europeans temporarily trapped in the UK and millions of furloughed workers counted as employed.” Teachers will have to wait until early 2022 for the first data releases, ahead of the full data being published in March 2023.
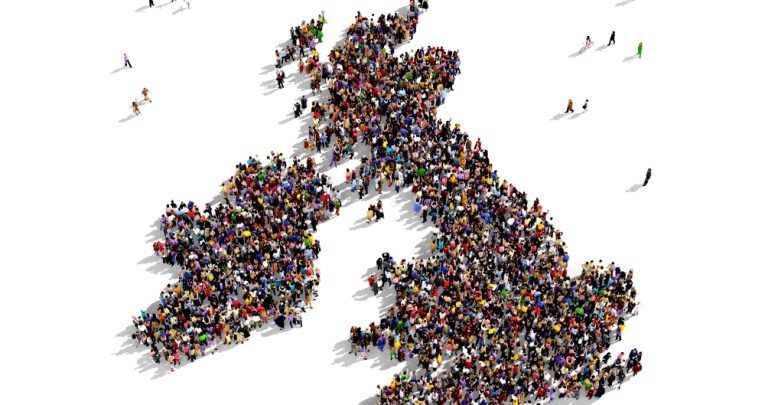
Already, however, there is a wealth of data from earlier Census that teachers can start using now. The 2011 survey, for example, identified that:
- The resident population of the UK was 63.2 million (representing a growth of 7% since the previous 2001 census)
- 87% of the population described themselves as belonging to a white ethnic group
- The top three countries of birth for non-UK born residents were India, Poland and Pakistan
- The numbers of cars and vans available to UK households had risen from 26.7 million in 2001 to 30.7 million in 2011
Many research geographers have dug deep into this data to unearth new insights. Professor Dorling’s work on inequality drew on 2011 Census data to highlight how, “Above the fifth floor of all housing in England and Wales, only a minority of children are white. The majority of children ‘living in the sky’ in Britain are Black.”
The ONS’ ‘Understanding towns in England and Wales’ spatial analysis provides a further wealth of information regarding the nature of England and Wales’ 1,163 ‘towns’ (classed as populations between 5,000 and 225,000) and their changing demographics, incomes, rates of employment and levels of deprivation.
Required versus voluntary
The Census’ questions change and develop over time, leading to new insights regarding who gets counted and how, and providing greater detail about the UK’s human geography. Some questions are compulsory, while others are voluntary.
The 2021 Census included a new question on whether respondents had previously served in the armed forces, as well as a voluntary question (for those aged 16 and above) on sexual orientation and gender identity.
A perennial media story around the time of the Census concerns the answers respondents give to questions around their religion, often against a backdrop of campaigning for something new to be added to the list of recognised religions. In 2011, 176,632 individuals listed their religion as ‘Jedi’, making it the seventh largest religion listed in the census returns. A further 6,000 people listed their religion as ‘heavy metal’.
Census data can be used to help tackle many areas of the geography curriculum, including the requirement for pupils to better understand the characteristics of where they live and other areas within the UK.
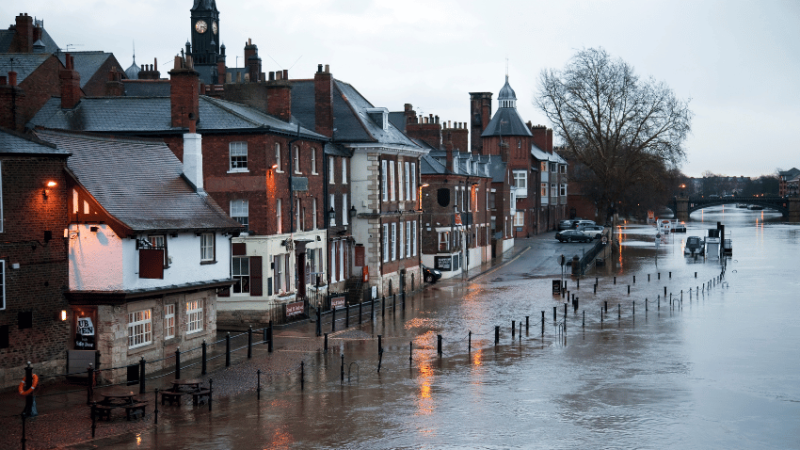
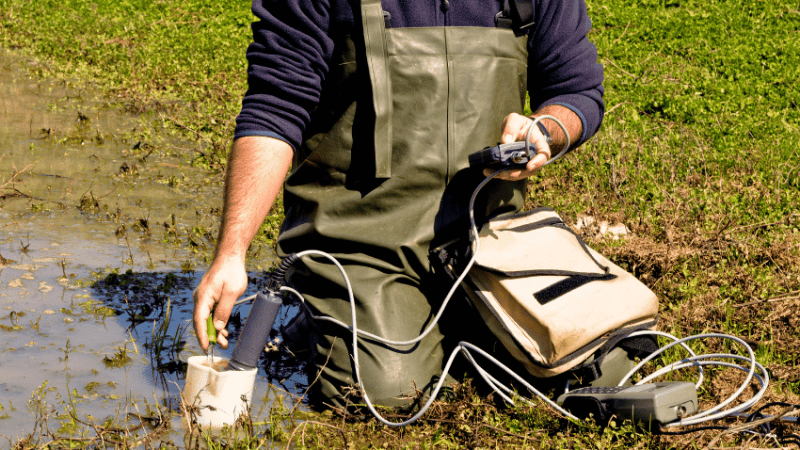
It can support KS3-level studies of population, urbanisation and economic activity, as well as lessons around the UK’s human landscapes, and rapidly changing economy and society, and provide valuable baseline data against which fieldwork results can be compared and contrasted.
Curriculum opportunities
The term ‘output area’ (OA) refers to the smallest geographical area that census data is provided for.
There are around 171,000 Oas in England alone, with the minimum population size being no less than 40 people (to protect peoples’ confidentiality). In 2011 the largest OA was located in Canterbury, with a population of 4,140.
Data can also provided at ward or parish level, from built-up areas or from local, county and national authorities. Teachers and pupils can easily search for data on their nearest AO, local ward, home town or even elsewhere online by simply entering a place name or postcode.
There are many practical ways in which to embed Census data within your lessons. Your class, year group or school could even undertake a census of its own, comparing your results to the picture of your local area presented by the national data.
Teachers can set homework or create displays that use Census data to provide the geographical context for a new case study. Official data can also be invaluable when fact-checking sources and exploring sometimes erroneous views around levels of immigration, and/ or the UK’s ethnic or religious mix.
There are also plenty of opportunities to incorporate Census data when using geographic information systems. For instance, there’s a guide produced by Esri UK which shows how data can be entered into the ArcGIS mapping and analytics platform and rendered visually. Finally, older pupils could try applying statistical tests to Census data in order to explore various geographical concepts and themes.
What can you see?
A two-minute search of my own local area of Enfield reveals…
- 312,466 residents living in 122,421 households
- 61% from white ethnic groups, 18% from Mixed/multiple ethnic groups, 11% from Asian/Asian British, 17% from Black/African Caribbean/Black British groups
- 64.9% having been born in the UK and 35.1% outside
- 76.7% reporting that they have a religion
- 38,933 households owning no cars or vans, and 1,786 households owning four or more cars, or a van
- The smallest occupation group is mining and quarrying, with 41 males and 24 females working in those industries
Steve Brace is a former geography teacher, now head of education at the Royal Geographical Society, working closely with the DfE, Ofsted and Ofqual – follow him at @stevebracegeog; for more information about the RGS’ support for geography, visit rgs.org/schools or follow @RGS_IBGschools.