


Secondary School Applications Hit Highest Level In 8 Years
548,006 applications for secondary places received in 2016 – up 2.8% compared to last year
- by Teachwire
- Classroom expertise and free resources for teachers

The DfE has published official figures that show the number of applications for secondary and primary school places has continued to rise – and that the chances of children securing first choice of school still varies dramatically in different parts of the country.
Secondary places
548,006 applications for secondary places were received in 2016, representing a 2.8% increase compared with the 2015 figure of 533,314 and continuing an upward trend that began around 2013.
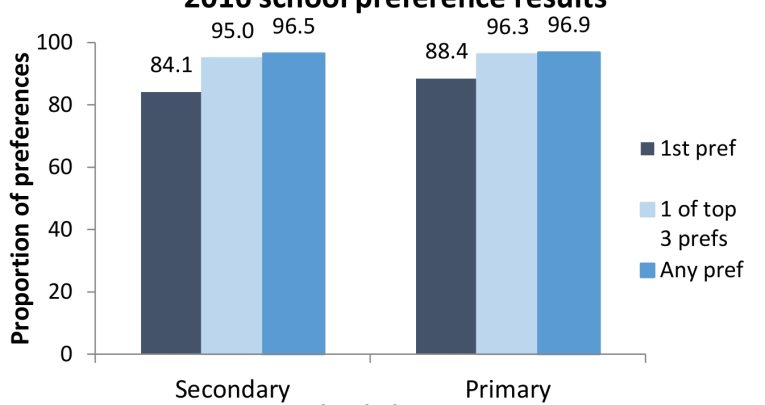
The overall proportion of applicants receiving an offer from their first choice school remained largely unchanged at 84.1% (down just 0.1% compared with 2015), as did proportion of those receiving an offer from any of their preferred schools – 96.5% this year, compared with 96.4% in 2015.
The regions with the highest proportion of applicants securing their first choices were the South West (91.9%) and and North East (91.8%). The three top performing LAs in terms of preference rates were Northumberland (98.7%), Central Bedfordshire (98.6%) and Cornwall (98.4%) – the same top three performers as in 2015.
Those with the lowest proportions of children receiving offers for their first choice of secondary school were, perhaps unsurprisingly, the London LAs of Hammersmith & Fulham (52.0%), Westminster (53.4%) and Lambeth (57.9%).
Primary places
The 641,572 applications received for primary places is also up on last year, albeit by a smaller increase of 0.8%. The proportion receiving places at their first preference was 88.4% – a rise of 0.6 percentage points compared with 2015.
The North East came out top as the region with the highest proportion of applicants receiving their first preference at 92.7%, while the LAs with the highest first preference rates were 2016 Redcar & Cleveland (97.4%), Cumbria (96.4%) and Doncaster (96.3%).
The three LAs with the lowest first preference rates were Kensington & Chelsea (68.3%, though a markedly better figure than the 59% it reported in 2015), Hammersmith & Fulham (71.9%) and Bournemouth (76.1%) – the latter of which marks the first time that a non-London LA has featured in the bottom three since primary national offer day data first started being collected in 2014.