


This PowerPoint contains two learning grid templates to help your KS3 students write about weather.
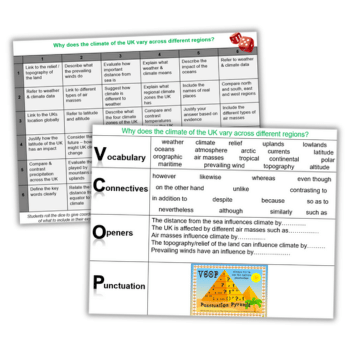
The learning grids support extended writing and deliberate practice. The first KS3 weather learning grid involves students rolling a dice to get random coordinates. They then need to use these prompts within their explanatory writing about why the UK’s climate varies across regions.
The second grid encourages the use of correct vocabulary, connectives, openers, and punctuation (VCOP) to enhance students’ writing skills.
Teaching the weather at KS3
For a nation that is infamous for its obsession with predicting, discussing and complaining about the weather, you’d think we would also love teaching it – wouldn’t you?
And yet, when asked what topics teachers find dull to cover (particularly at KS3), or that students find difficult to grasp, one of the most frequently named is indeed the dear old weather!
On the surface, the weather seems easy. We see it all around us. We have ‘known’ what it is since we were tiny children.
It is one of the first things that toddlers learn to look at and talk about. We study it at primary school, and then again at secondary. Perhaps it is fatigued by overuse, by familiarity – by just being there.
It could also be that it’s difficult to consider the more complex matters of weather and climate because we already think we know it inside and out.
We are used to treating it superficially, then when presented with the actual complexities we are daunted, deflated, and therefore defeated.
In fact, of course, the actual mechanics of atmospheric circulation, global currents, climate cycle oscillations, the difficult-to-say-and-even-harder-to-explain El Niño/La Niña phenomena, Milankovitch cycles, Hadley Cells, oceanic conveyor systems, Coriolis forces, global winds, solar variation, biochemistry, and all the multitude of variables that must be mathematically computed in order to make meteorological predictions are somewhat mind-blowing.
As the expression goes: “It ain’t rocket science… it’s harder”; and it’s not unusual for something that students find difficult to conceptualise to be perceived by them as ‘dull’.
KS3 weather curriculum requirements
Let’s remind ourselves of what is explicitly required of us in the KS3 statutory orders.
We are to teach pupils to “…understand, through the use of detailed place-based exemplars at a variety of scales, the key process in physical geography relating to weather and climate, including the change in climate from the Ice Age to the present…” and to “understand how human and physical processes interact to influence, and change landscapes, environments and the climate…”.
Teaching about the weather could also be woven into explaining “…how geographical processes interact to create distinctive human and physical landscapes that change over time…”, used to demonstrate the use of “…geographical knowledge, approaches and concepts (such as models and theories) and geographical skills…”, and discussed in terms of “…environmental regions, including polar and hot deserts…” or the “…physical geography of a region within Africa, and of a region within Asia…”.
Pretty vague and open isn’t it? KS3 orders are an intentionally skeletal framework, that allows our professional judgement to determine how much depth we wish for particular aspects.
We can choose to spend weeks on the monsoon, UK climate, global climate zones, atmospheric circulation, the Ice Age, anticyclones, depressions, polar oceanic currents, etc. Or, we can choose not to.
Yes, we may be partly influenced by future GCSE considerations, and yes, we want students to understand their world and its processes. But this does not mean losing all creativity?
We can battle the ‘dull’ and inspire the curiosity whilst imparting knowledge.
KS3 weather activity ideas
Layered UK climate mapping
Take a blank UK outline map printed three times: once on white paper, and again on two pieces of tracing paper. Give students UK average temperature and precipitation choropleth maps, and a relief map.
On the white paper outline, have them mark major areas of relief, as well as labelling seas and prevailing winds if desired. This is their base map.
On one tracing paper, have them shade temperature variations, including a key. On another tracing paper outline, they should shade precipitation.
Staple all three maps together, to form a multi-layered resource. Now ask students to interpret the maps, considering regional variations and their causes.
GIS links
This site is a GIS visualisation of atmospheric and oceanic circulation. Students can explore and identify links between ocean temperatures and climate or climate hazards (useful when studying tropical storms).
Meanwhile, the MET Office site is useful for visual mapping and data of UK weather, and you can contribute to community science by adding weather data to the site.
Climate ‘who am I’ mystery cards
Have a selection of different mystery cards describing various climatic zones. Eg “Homes are built on stilts to avoid flooding by heavy monsoon rains”, “Few people live here due to winter temperatures of -22°C and winds in excess of 30mph”, etc.
Students match the mystery cards to a global climate zone map and justify their answers.
Silent weather report
Play a BBC weather report but mute the sound. Students watch in silence the first time. Allow five ‘Yes/No’ questions about what they have seen, then the second time they must provide a voiceover script themselves (by writing this in their books, speaking aloud to a partner, etc).
Have high expectations about the use of key geographic terms, direction, place names, etc. Finally, play the report with the sound and see how accurate they are.
Mr Happy Air Masses
Tony Cassidy created this idea some years back, and you can find a template here if needed. Basically, different Mr Happy templates represent each of the air masses affecting the UK.
These are colour-coded / clothed / annotated to explain how the air masses differ, then plotted on a map.
Chatterpix/ThingLink
Create talking photos to describe and explain the weather. This requires students to explain the conditions they experience fully, and to consider what a static photograph will show and its limitations as evidence.
It is tempting to say, “as you can see, the trees are moving in the wind” – but a static photo won’t show this. This forces learners to consider carefully what they will capture to prove the weather conditions, and what commentary makes sense.
Climate zone maps vs graphs
On A3 paper have a climate zone map in the centre. Give students a climate graph that matches each climate zone.
They must identify the correct location from its graph, stick this onto the paper linked to the correct zone, and then annotate this with what the climate trend is and why they believe it is from this zone (link to numeracy skills).
Jo Coles is an assistant headteacher currently on maternity leave, geographer, RGS fellow and Chartered Geographer, GA consultant, award-winner, examiner and author.