

Excel, Word, PowerPoint and KEY files
KS3, KS4
Years 7-11
This is a series of cross-curricular lessons looking at stories of migration and data. It’s a great activity to work on during Refugee Week.
The sessions promote creative, critical thinking. After examining the included migration data, students will ask and answer questions, presenting their findings via infographic posters.
The download includes four lessons (PowerPoint and Keynotes files) and accompanying resources:
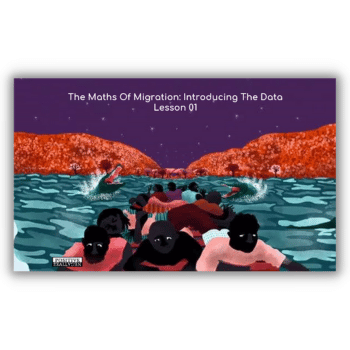
- Session 1 (approx one hour): introducing the context and data
- Session 2 (approx 30 mins): introduction to infographics
- Session 3 (approx 30 mins): planning the poster
- Session 4 (approx one to two hours): creating the poster
- Session 5: poster conference
- Primary data from Mediterranean Migration Crisis project (MEDMIG)
- Excel help sheet
NOTE: the issues in these sessions may resonate with some learners, and some viewers may find the animation traumatic. Please watch it before showing to your class, and consider alerting learners of its nature before viewing.
How the resources were made
Using a multimedia approach, Jess Barnecutt was able to help her students dig deeper into data, discovering stories about refugees and themselves…
As head of maths at Oaklands School in Tower Hamlets London, many of my students are second- and third-generation immigrants. The journeys their grandparents and parents made to Britain mean that migration is an important cornerstone of our school community.
Our learners’ family histories are part of a wider East End story. Successive waves of migrants, refugees and asylum seekers have shaped our dynamic cultural landscape.
As recent research suggests that roughly one in 80 people will migrate to another country in the next five years, global migration (estimated to include 70-80 million people annually) is part of our shared future.
But several years ago, I started seriously considering how we could allow pupils at Oaklands to better understand the complexities of migration. I wanted to equip our students with the skills to make independent, informed decisions about the role of migrants and refugees within our society.
Creative resources
I got in contact with the non-profit organisation PositiveNegatives, which makes comics, animations and visual narratives based on real-life stories.
The team agreed to collaborate with me on new learning resources to encourage creative, critical thinking.
The teaching packs we made together responded to PositiveNegatives’ and artist Karrie Fransman’s zoom animation ‘North Star Fading’, which is based on the story of four Eritrean refugees.
These packs also made use of a database, created by Professor Heaven Crawley at the University of Coventry, containing information on over 500 refugees and migrants who arrived in Europe during 2015.
Working with PositiveNegatives, I planned to use this data in my lessons at Oaklands, marking the beginning of a cross-curricular project we called ‘Voices of Migration’.
I ran the first, pilot sessions — called ‘Maths of Migration’ — in December, during two weeks of classes for year 10 pupils. After introducing them to Heaven’s data, I asked the students what they would like to know from these statistics.
I explained that they would create and answer their own questions, presenting their findings through infographic posters.
‘Special and serious’
Although I suspected that students would focus on the danger of the Mediterranean sea voyages, I was wrong. To my surprise, they were more interested in what these peoples’ lives were like before they travelled, and how they changed afterwards.
They focused in on levels of education and employment, trying to understand how daily life is permanently altered by migration.
Anisul, who’s 15, explained that the process of interpreting the data ‘felt very special and serious at the same time’.
He understood that this was ‘real life’, rather than an abstract set of numbers. His classmate, Faiza, added that this was ‘a very different way to how we usually learn … it’s making us responsible for the work we do’.
During these early pilot sessions I watched on, feeling excited, as they and their classmates used maths skills to investigate a social justice issue. I was struck by the students’ empathy towards these people and their experiences.
In some cases we explored individual interviewees’ journeys. The data revealed how many of them had lost friends and loved ones on the dangerous journey into Europe. My students were taking these stories seriously, while also using their maths skills to explore a set of data.
Beyond the numbers
The posters showcasing each group’s findings were a riot of colour: world maps adorned with multi-coloured routes and pie-charts outlining what percentage of participants were married, how many were unemployed, and how many travelled with children.
One poster on the specific experiences of older migrants (classed as 60 years+) noted that, although the average number of accompanying children was one per migrant, this particular demographic travelled, on average, with three.
By focusing on particular aspects of the data, our students revealed many different stories, allowing them to reflect on the complex reasons people choose to leave home.
‘Voices of Migration’ became a school-wide project, spanning lessons in maths, history, English, art, drama and ICT.
As a community, we’re developing our own creative and critical responses to migration, trying to better understand the ongoing, global story of human movement in which we all have a role to play.
Jess Barnecutt is Head of Maths at Oaklands School, Bethnal Green. For more educational activities and videos bringing to life humanitarian, social and other contemporary issues, please visit PositiveNegatives education.