

This free PowerPoint and worksheet cover plotting scatter graphs, identifying correlations and using lines of best fit.
We use scatter graphs to represent two linked pieces of data. Once plotted, you can more easily find patterns and make estimates from it.
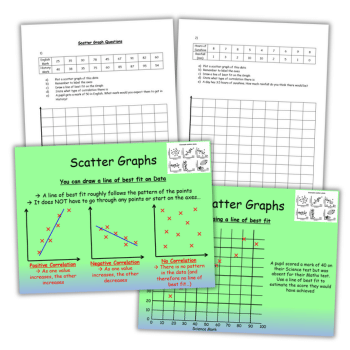
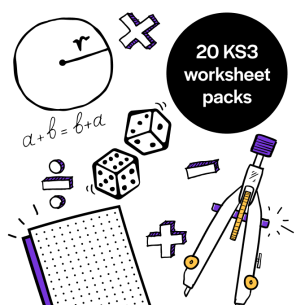
Scatter graphs worksheet
The scatter graphs worksheet contains six scatter graphs to have a go at. For example, in question 1, a table of English marks and history marks is given. Pupils need to:
- Plot a scatter graph of this data
- Remember to label the axes
- Draw a line of best fit on the graph
- State what type of correlation there is
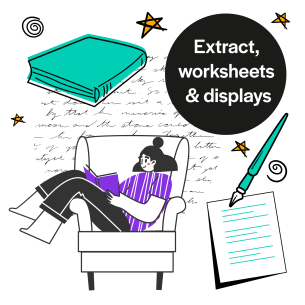
They then need to answer an additional question: ‘A pupil gets a mark of 50 in English. What mark would you expect them to get in history?’.
Scatter graphs PowerPoint
This scatter graphs PowerPoint contains a starter, main activity, plenary and final summary.
Learning objectives
- Plot a scatter graph for a set of relevant data (all)
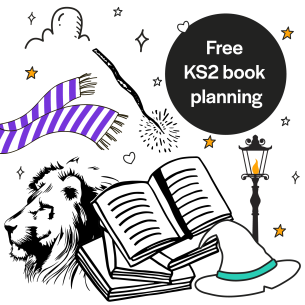
- State the type of correlation (most)
- Draw an appropriate line of best fit and use it to make estimates (some)
KS3 maths curriculum area
Probability: Record, describe and analyse the frequency of outcomes of simple probability experiments involving randomness, fairness, equally and unequally likely outcomes, using appropriate language and the 0-1 probability scale
Owen134866 is a TES Resource Contributor of the Year and blogger. You can find his resources on his TES page.