


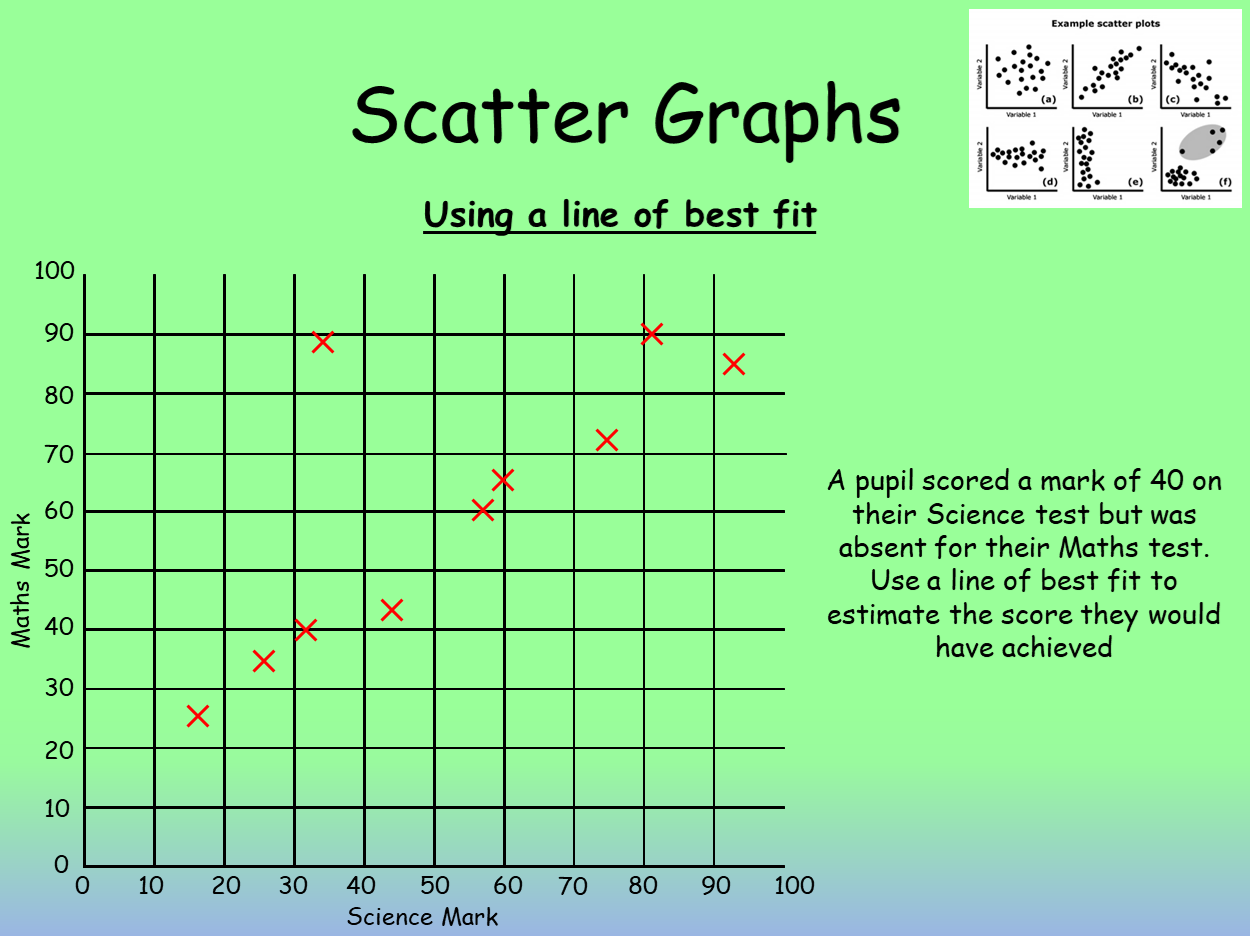
PowerPoint and worksheet on plotting scatter graphs, identifying correlation and using lines of best fit.
The data on the sheet has come from somewhere else but I’m not sure exactly where! You will need to write over some of the slides.
KS3 Maths Curriculum Area
Probability Record, describe and analyse the frequency of outcomes of simple probability experiments involving randomness, fairness, equally and unequally likely outcomes, using appropriate language and the 0-1 probability scale
Owen134866 is a TES Resource Contributor of the Year and blogger. You can find his resources on his website mathsfreeresourcelibrary.com and on his TES page Owen134866’s Shop.
DOWNLOAD A FREE RESOURCE!
Plotting Scatter Graphs PowerPoint and Worksheet for KS3 Maths