


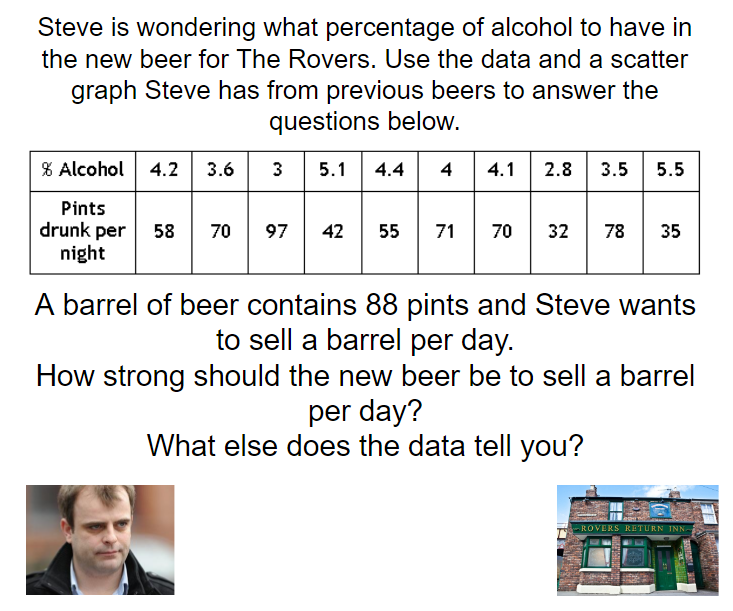
Help out the famous Weatherfield residents of Coronation Street with their data issues by drawing and using scatter graphs.
KS3 Maths Curriculum Area
Statistics Describe simple mathematical relationships between two variables (bivariate data) in observational and experimental contexts and illustrate using scatter graphs.
 Andy Lutwyche is a purveyor of mathematics and a producer of resources, more of which you can find on his TES shop. You can also follow him on Twitter at @andylutwyche.
DOWNLOAD A FREE RESOURCE!
Correlation Street Draw and Use Scatter Graphs Activity for KS3 Maths