


Various tutorials taking you from grade F to A – bar charts to histograms, simple averages to estimating their mean.
KS3 Maths Curriculum Area
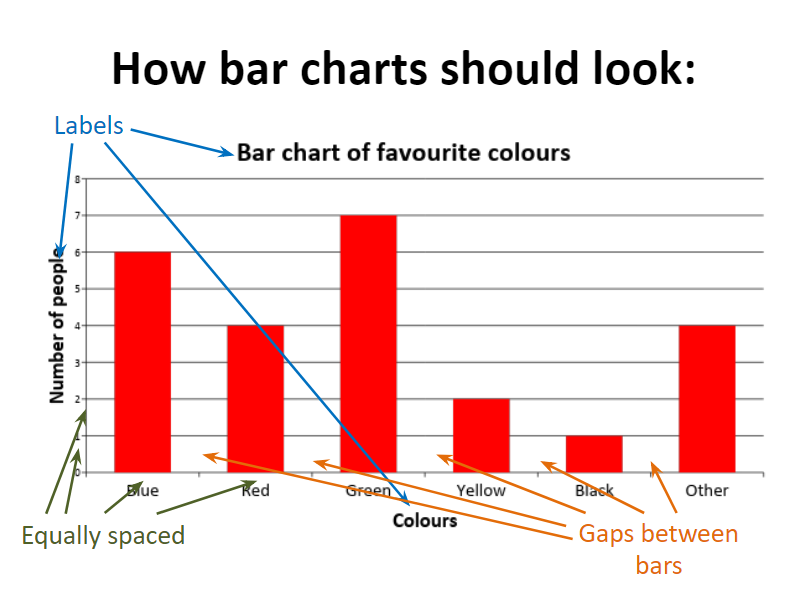
Statistics Construct and interpret appropriate tables, charts, and diagrams, including frequency tables, bar charts, pie charts, and pictograms for categorical data, and vertical line (or bar) charts for ungrouped and grouped numerical data
 Andy Lutwyche is a purveyor of mathematics and a producer of resources, more of which you can find on his TES shop. You can also follow him on Twitter at @andylutwyche.
DOWNLOAD A FREE RESOURCE!
Calculating, Displaying and Interpreting Statistics Tutorials for KS3 Maths
Similar resources
- Simplifying algebraic expressions – KS3 lesson without boring drills
- Maths games GCSE – Million Pound Drop & other games
- Factorising quadratics worksheet – 13 exam-style questions
- Factorising quadratic expressions – Unpick what’s going on
- Factorising quadratics – Construct your own quadratic equations