
Learning To Analyse Data Isn’t Just A Maths Skill – It᾿s A Skill For Life

Teachers understand, perhaps more than most, how statistics don᾿t always tell the whole story, which is why data analysis is so important


Have you ever noticed that whenever statistics are added to an argument, they seem to give it credibility? Advertisers, as well as politicians, know this very well.
Many readers will have imprinted on their minds the tagline from a famous Whiskas cat food advert, which proclaimed ‘Eight out of 10 cats prefer it.’ But rather than accepting statistics at face value, we need to help children move beyond the figures and ask critical questions: which cats? What about the ones who did not prefer it? What did they prefer?
While statistics are essential to our decisions, the topic can seem rather cold, impersonal and abstract to children. However, this does not have to be the case. Delving into the world of statistics is a chance to support pupils’ understanding across the curriculum and enable them to see the value of numerical data in everyday life.
The 2014 national curriculum requires schools to teach statistics (formerly data handling) through Years 2 to 6, and children᾿s names provide the ideal starting point for developing statistical thinking – especially at the beginning of term when teachers are getting to know their classes.
From Year 2, pupils are expected to record, interpret, collate, organise and compare information. In Years 3 and 4, pupils continue to interpret data with increasing accuracy, and they should begin to relate the graphical representation of data to recording change over time. In Year 5, pupils should decide which representations of data are most appropriate, and say why. And in Year 6, they should encounter and draw graphs relating two variables – arising from their own enquiry and in other subjects.
Seeing the bigger picture
Every August, the Office for National Statistics publishes the most popular baby names from the previous year, which can be viewed by region and country through the UK. (These can be viewed on the Office for National Statistics.)
To illustrate how such data can be sorted, start in the hall or playground and encourage the class to ‘get into groups of people with names that start with the same letter᾿ or ‘find someone whose name has the same number of letters as yours’. What other ways can the children think of to sort their names?
Take boys’ names as an example. Write the top 10 names on cards and ask the children to decide which is their favourite from this list. How could they arrange themselves to make it possible to see which is the most popular name? At this point, some may suggest that they sort themselves into groups.
Once they’ve done this, ask them if there is a way to easily see which group has the most people in it. Guide the children towards understanding how standing behind their favourite name in a neat line helps to make sense of the data, then take a photo to record the living graph.
Back in the classroom, the same process could be modelled for girls’ names using sticky notes and large sheets of paper – the children write their names on sticky notes, sort them into groups, and finally into a block graph.
A run of Ronaldos
Extend the children’s thinking by considering other questions that could be asked about the data, or by providing a graph from two or more different years and asking them to talk about similarities and differences in popular names.
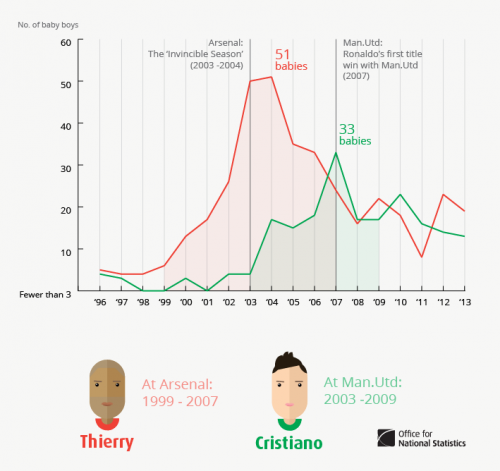
Compare the ‘top 10᾿ lists from 2015 with previous five years and ask the children to look for trends. Extend this to historical data available online at the National Archive website. Play to the children’s interests. For example, in football, Cristiano and Thierry both have peaks that correspond with Ronaldo and Henry’s times at English clubs.
Perhaps your school contributes to the CensusAtSchool project. This collects and disseminates real anonymised data for use by teachers and older pupils on subjects such as pocket money and use of social media. You can use the Random Data Selector to take samples of raw data since 2001 from the website. You choose the size of sample (e.g. 10, 20, 30 up to 200) and then request ‘Get Data’. The data is downloaded as an Excel file.
How to plan your own investigation
When planning, children should work through a cycle of problem solving so that they understand the process of statistical thinking. After all, this is what real statisticians do. Typically, they begin by asking questions (planning). They then consider the kind of data they need and where it is located (collecting), before sorting the data (analysing) and sharing the outcomes (presenting).
1 Planning Most investigations begin with ‘wondering’ about something – so find a subject from the census data that appeals to children. For example, they might be interested in finding out the most common names in your region, in the month of their birth or over time.
Do they need to compare across years, or will one year provide the information they need? What size of sample will they use to provide a manageable and meaningful result? Will the census provide all the information they require, or might they need to use other sources?
2 Collecting Discuss what sort of data the children need to collect, and how they will record it, eg list, table or tally chart. They might tally the number of Amelias and Olivers in the school and compare to the national picture. Or they could look at the least common name in the class or school. How many children in the class have middle names, or double-barrelled surnames?
3 Analysing The census can provide the opportunity to explore raw data that children have not had to collect themselves. This has some advantages – particularly that the teacher knows everyone has the same information, without worrying about the accuracy of their recording methods. For example, the data will allow children to analyse which Beckham baby name has had the biggest impact on trends in naming babies.
Older children could find the mode, the median and the mean of a particular data set and evaluate when each average would be a useful measure. At every age, encourage children to think about what they notice, and what they wonder. 4 Presenting Making sure data is presented clearly and accurately is an important aspect of data handling. There are many good packages available to schools to help with this, including, for example, 2simple.com/2calculate.
What᾿s the point?
It is important to discuss with children who uses statistics. So with the example discussed in this article, you might ask the class who would want to know about baby names. Can they think of people other than parents and soon-to-be parents who would want to pick a popular or rare moniker? What about those involved in the manufacture and sale of named items, such as mugs and name tags? Researchers may want to know about changes in culture, reflected in the choice of names.
Children are surrounded by data in newspapers, shops, social media and on the television. Statistical literacy – the ability to review, interpret and evaluate this information – is an essential competency for children and young people to make sense of their everyday lives.
For readers with a keen eye for statistical education, why not take these ideas further by becoming an e-teacher member of the Royal Statistical Society, which is free and offers opportunities for continuing professional development and the sharing of best practice.
Dr Russell Grigg is executive head of research at the head of the Wales Centre for Equity in Education and Helen Lewis is programme coordinator for primary PGCE within the centre.